Title Sign up to our newsletter Image Image Body Sign up now to get latest news, events, jobs and ticket giveaways from Barking and Dagenham Council Sign up to our One Borough newsletter
Cost of living survey Help us improve the cost of living support in Barking and Dagenham by taking part in our survey. Your feedback is invaluable in enhancing the support we offer! More information Hide
About Barking Riverside ward Image Did you know that Barking Riverside has: 11,682 residents – 8th lowest in the borough 3,440 under 16s - highest proportion in the borough 7,849 16s to 64s - 6th highest proportion in the borough 393 65 and over – lowest proportion in the borough 30 average age – 2nd youngest in the borough 52.8% deprived households – lowest in the borough 52.1 average attainment 8 score per pupil (GCSE) –highest in the borough 15.9% adults with no qualifications - lowest in the borough 49.6% open space - 3rd highest proportion in the borough 85.2 births per 1,000 women of childbearing age –highest in the borough 92.7 crimes per 1,000 people - higher than the borough average (86.4) 15.9 domestic abuse offences per 1,000 people - higher than the borough average (14.8) £349,200 median house price (all types) - lower than the borough average (£370,000) 5.7% unemployment related benefits claimants - lowest in the borough 32.6% Pension Credit claimants - higher than the borough average (24.3%) 13.0% Universal Credit claimants in employment - highest in the borough 80.6% Black, Asian and Multi-Ethnic population - higher than the borough average (69.1%) 36.0% obesity amongst children in Year 6 - highest in the borough 2.7% NEET and Not Known - lower than the borough average (3.7%) 
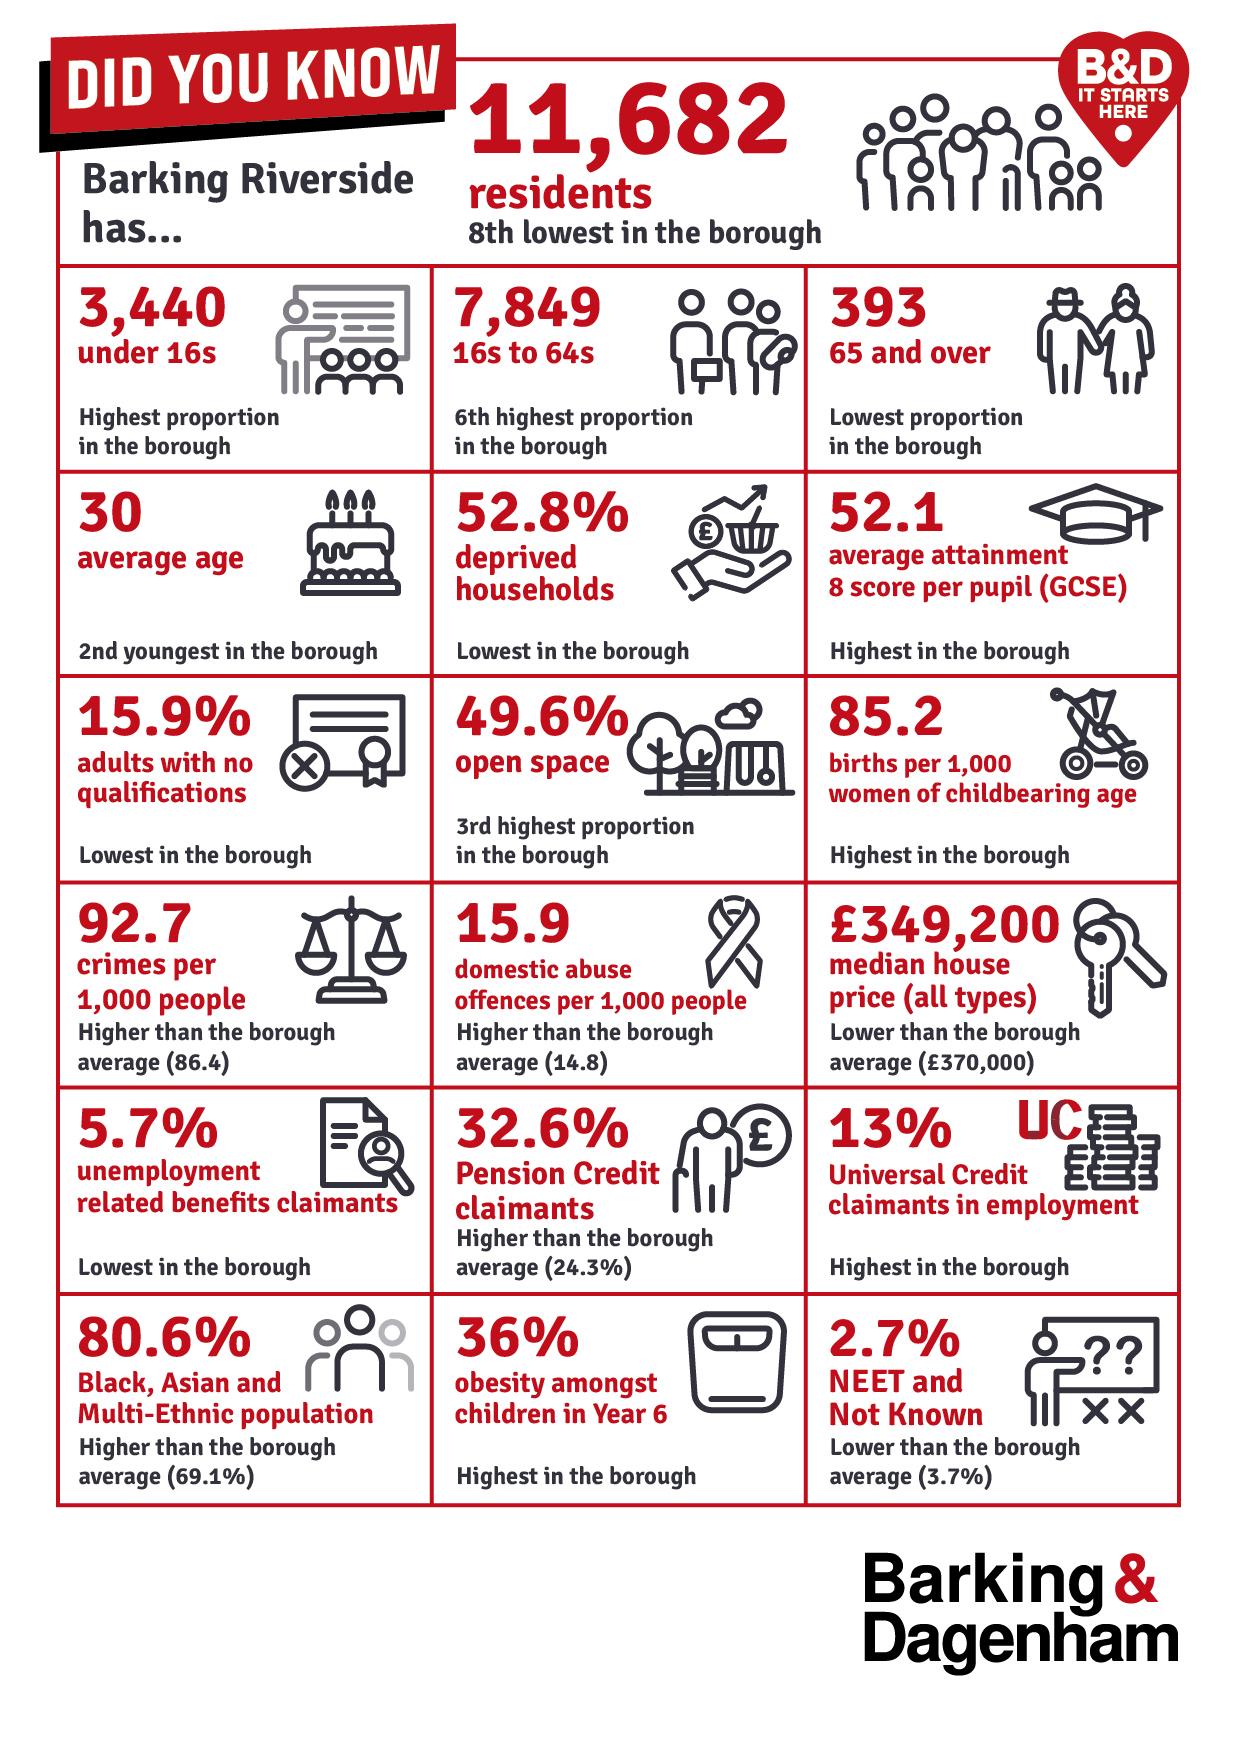
Infographic - Barking Riverside - did you know? (PDF, 157.84 KB)