About the borough
About Becontree ward
Image
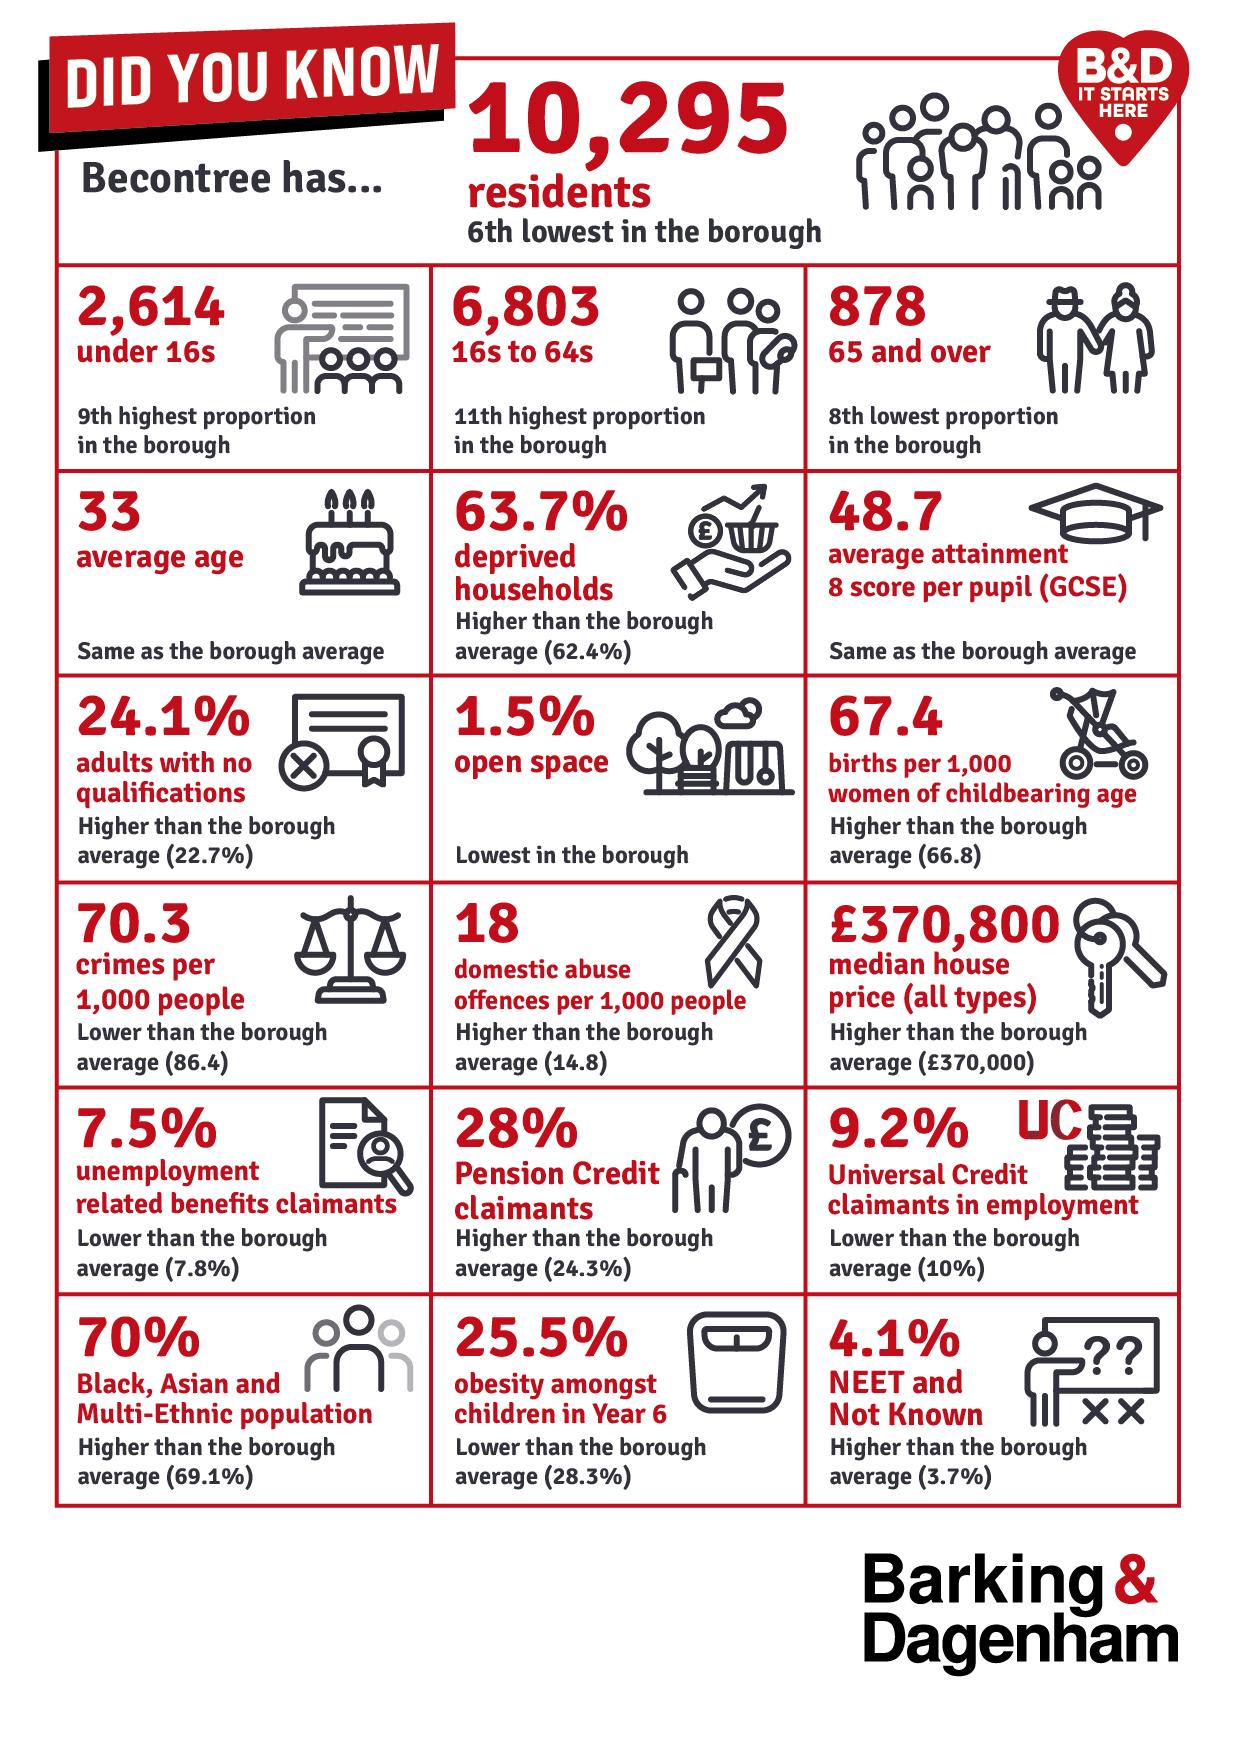
Did you know that Becontree has:
- 10,295 residents - 6th lowest in the borough
- 2,614 under 16s - 9th highest proportion in the borough
- 6,803 16s to 64s - 11th highest proportion in the borough
- 878 65 and over - 8th lowest proportion in the borough
- 33 average age - same as the borough average
- 63.7% deprived households – higher than the borough average (62.4%)
- 48.7 average attainment 8 score per pupil (GCSE) –same as the borough average
- 24.1% adults with no qualifications - higher than the borough average (22.7%)
- 1.5% open space - lowest in the borough
- 67.4 births per 1,000 women of childbearing age - higher than the borough average (66.8)
- 70.3 crimes per 1,000 people – lower than the borough average (86.4)
- 18.0 domestic abuse offences per 1,000 people – higher than the borough average (14.8)
- £370,800 median house price (all types) - higher than the borough average (£370,000)
- 7.5% unemployment related benefits claimants - lower than the borough average (7.8%)
- 28.0% Pension Credit claimants - higher than the borough average (24.3%)
- 9.2% Universal Credit claimants in employment - lower than the borough average (10.0%)
- 70.0% Black, Asian and Multi-Ethnic population - higher than the borough average (69.1%)
- 25.5% obesity amongst children in Year 6 - lower than the borough average (28.3%)
- 4.1% NEET and Not Known - higher than the borough average (3.7%)
Infographic - Becontree - did you know? (PDF, 157.7 KB)